BUDGETING TIP OF THE MONTH
Conditional Formatting
As most nonprofit organizations leverage Excel for their reporting and analysis, utilizing Conditional Formatting can be helpful in highlighting changes across periods. This tool allows you to easily summarize differences using color schemes to detail high to low or top and bottom drivers within a data set. The format enhancements assist the audience to visually follow whether the change or trend identified is beneficial or negatively impacting the organization.
In the screenshot below, the percentage change columns (D and H) reflect Conditional Formatting (which can be found under the 'Home' ribbon). As this represents expenses, decrease to increase is shown from green to yellow to red.
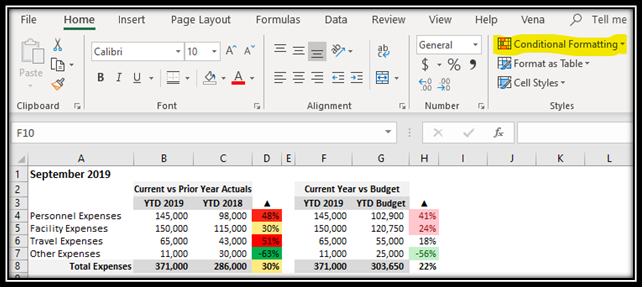
Column D shows a 3-color scale format to display high, low, medium change year over year, whereas column H shows top and bottom change drivers between current year and budget.
Formatting details shown below: (left for column D, right for column H)
.png?width=784&name=pasted%20image%200%20(1).png)