BUDGETING TIP OF THE MONTH
Sum vs Subtotal and Cell Dependency
Often times when working with large datasets for budgeting and forecasting, duplication of data occurs during consolidation of reports. This requires a thorough reconciliation of compiled data in order to maintain data integrity for analysis. The following will explain how to create a multi-function formula that can assist in reviewing datasets without manipulating them into a report.
Many Excel users have utilized the common AutoSum function, which simply totals selected cells in a worksheet. While this can work for most report calculations, another multi-use formula that gives user an additional layer of functionality is the Subtotal formula. This function not only adds values in a selected range, but also allows datasets to be refined using filters without redefining the formula parameters. In addition to adding values, the Subtotal function can also perform Count, Average, Max, Min, Product, Standard Deviation, and Variance tasks.
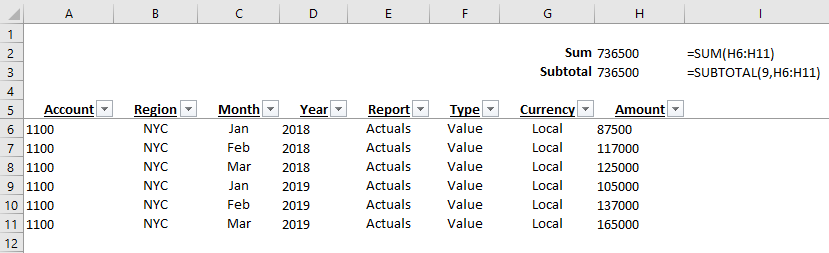
In the screen shot below, you can see both Sum and Subtotal formulas return the same value when
applied to a range (formula reference in column I2,I3).
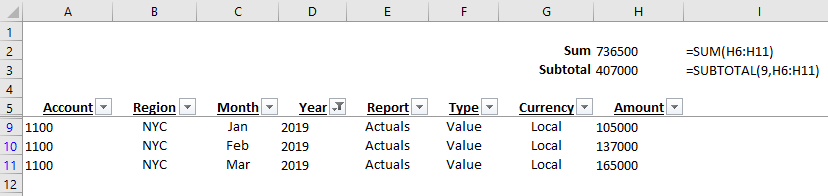
If a filter is applied to view 2019 data, you can see below the Sum formula remains the same, whereas the Subtotal returns the correct value based on the specified filter (formula reference in column I2,I3).
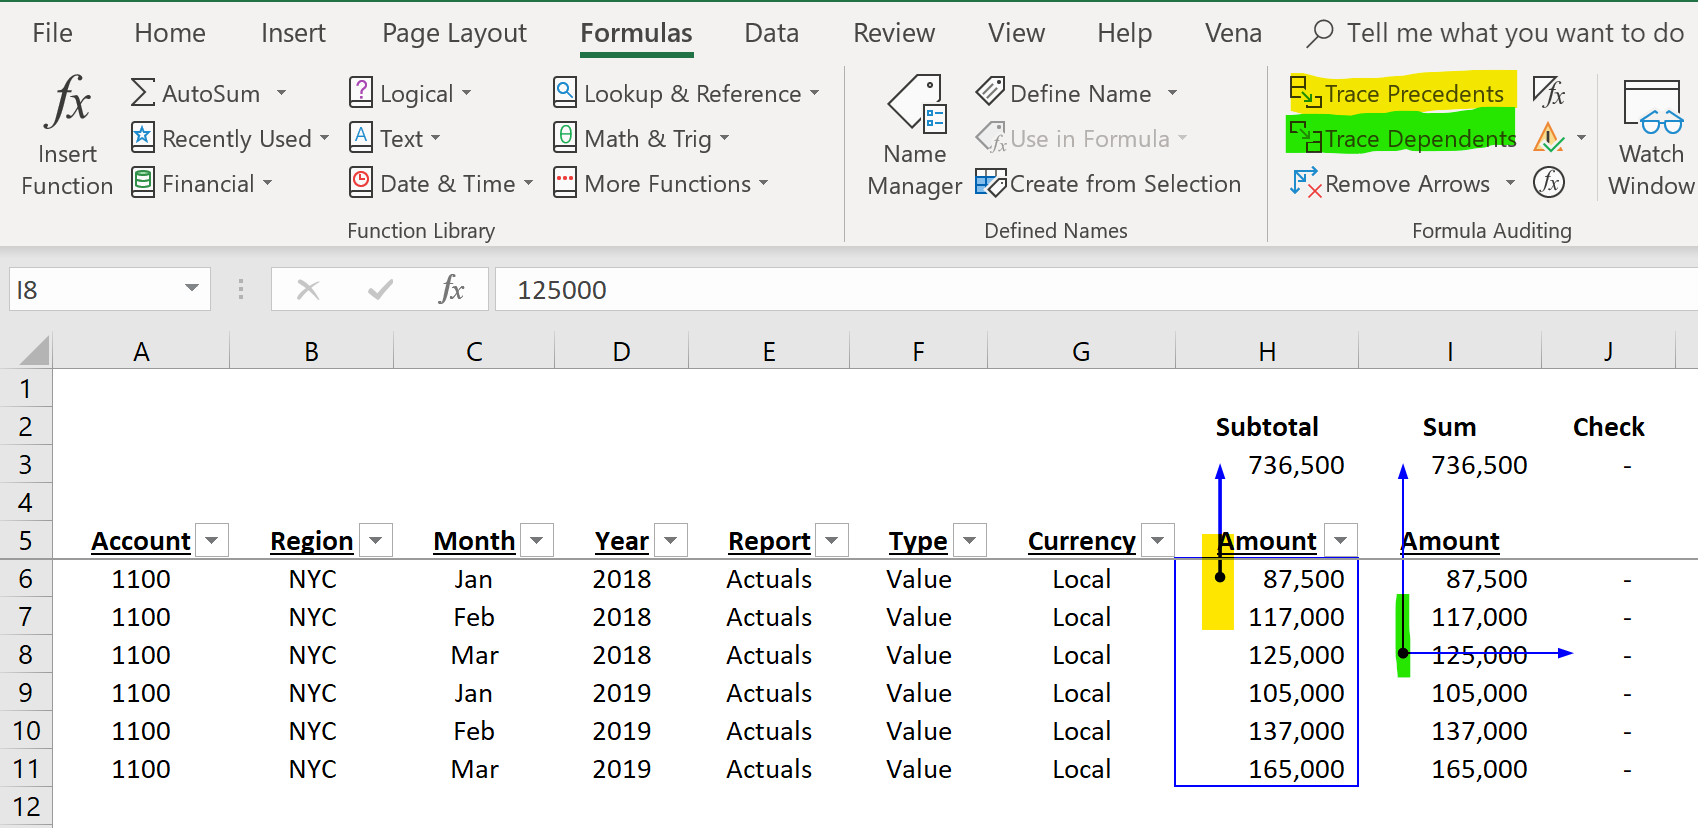
A helpful set of features in Excel to track cells impacting a formula are known as the Trace Precedents and Trace Dependents. In the screenshot below, the yellow highlight references the cell(s) that precede the formula, while the green highlight references dependent cell(s) for a formula.